
The first Community Energy results - how much of our energy is truly local?
Pete Nurse with assitance from Graeme Martin, Ana Spataru & Claude(!)
We're thrilled that 54 Alphington and Fairfield households have provided their energy meter data as part of the Community Energy Program (CEP) by the end of winter, and that number is now 60. Based on the information we have gathered so far, we can start to form a picture of our participants' energy use.
What are we measuring?
Community Energy % (CE%) is the percentage of total energy consumed that comes from local sources such as rooftop solar and the neighbourhood battery once measured. That means the solar you generate on your roof and use at home, plus any share of surplus solar that matches the consumption needs of participants who do not have sufficient solar generation themselves or have no rooftop solar. A household with a CE% of 60% got 60% of its electricity from local rooftop solar and the remaining 40% from the grid.
Our findings
Sunshine rules. The average CE% across all households was 65% in summer, 57% in spring, 52% in autumn and 37% in winter. No surprise: more sun, more local energy produced and consumed.
Solar and a battery make a big difference. Households with both solar and a home battery averaged between 56% (winter) and 84% (summer). Households with solar only averaged between 37% and 68%. Households with no solar still got between 15% and 42% of their electricity from neighbours' solar.
Roughly 20 points between each group. In every season, solar and battery households ran about 15–20 points above solar-only households, who in turn ran about 20–25 points above households with no solar.
Steady year on year. Winter 2026 averaged the same 37% as winter 2025, with autumn and summer within a couple of points of last year.
The big picture: about 60% of households so far registered to provide their meter data have solar only, and about 20% have solar with a battery and 20% have no solar or battery. This mix is representative of the Alphington and Fairfield area as a whole, as Alphington has one of the highest rooftop solar uptake in Victoria.
A few things to keep in mind
These numbers don't yet include the community battery's contribution. Once it's counted, we expect CE% to rise, and importantly, increase CE% for participants without rooftop solar.
With only a few dozen households, we're treating the conclusions with a pinch of salt. We are slowly onboarding more participants who have been accepted into the program.
Appliances play a part. Households with induction cooktops and heat pump hot water systems tend to do better, especially when paired with rooftop solar because they are large loads that are met directly by energy produced on the roof
We'll share the next breakdown at the end of spring. In the meantime, if your household is in the program, look at your own seasonal report to see where you sit.
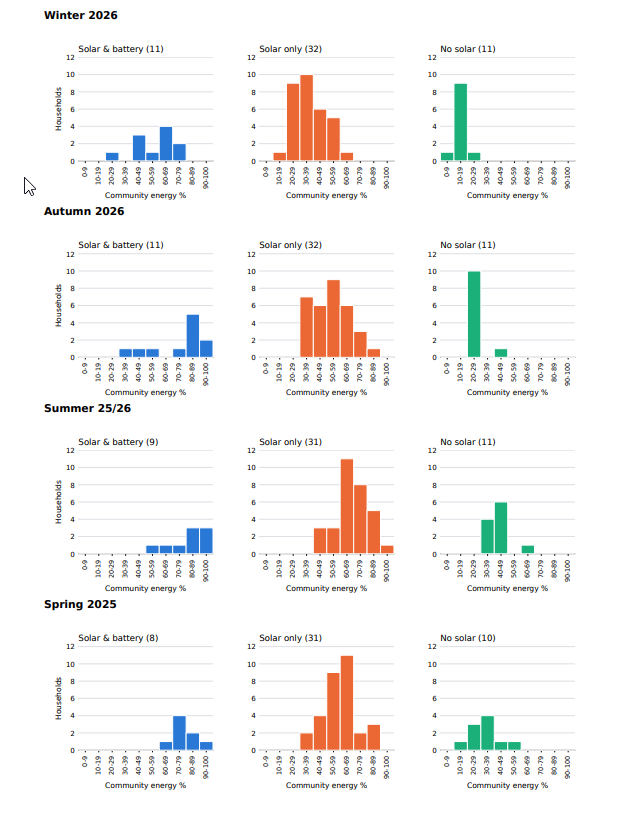
Double click for a better view of the image
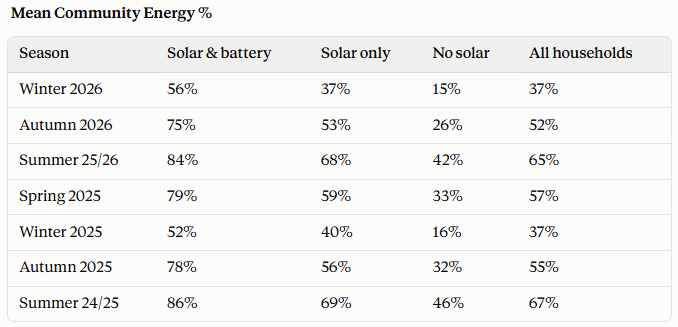
We define Community Energy as locally generated renewable energy from Household rooftop solar and our Community battery.
“Locally generated renewable energy” comprises 1) the solar energy created and used in the household and 2) that energy imputed to have been shared from excess produced in other households..
The Community battery contribution is not yet included.Given the limited number of households, our conclusions should be treated with “a pinch of salt”.
This breakup approaches our aspiration for our CE Program to approximate those of the whole Alphington/Fairfield region.
There is no doubt that this is influenced by the presence of low energy appliances such as induction cooktop and heat pump water heaters.